March 24, 2026
I Gave My Claude Access to ESP-IDF Monitor — And It Debugged My PCB
Last week, ESP-IDF v6.0 shipped with an MCP server built intoidf.py. The idea is great: let AI agents build, flash, and manage ESP32 projects. But when I tried using it, its use cases were limited — the server could build and flash, but it couldn't read what the device was saying back.
No monitor tool. No boot logs. No error messages. The agent could push code to the chip, but was completely blind to what happened next.
So I added monitor support and opened a PR upstream.
*Also a LinkedIn Post from my Professor!
The Technical Challenge
Wrapping idf.py monitorin a subprocess sounds simple, but two things make it tricky:
The TTY requirement.
idf_monitor.pycheckssys.stdin.isatty()and refuses to run unless stdin is a real terminal — it needs interactive terminal features like keystroke handling and control signals. When launched from an MCP server, stdin is a pipe, so the check fails, and the monitor exits immediately before it ever connects to the device.Process tree cleanup.
idf.pyspawnsidf_monitor.pyas a child. Kill only the parent, and the child keeps running, holding the serial port open. Next connection attempt: port is busy.
What I Built
The PTY (pseudo-emulated terminal) solves problem 1 — idf_monitor.pysees a real terminal and starts normally. Process-group killing (os.killpg()) solves problem 2 — the entire process tree gets terminated, so the serial port is freed cleanly.
Five tools, all using PTY-wrapped idf.py monitor, so crash backtraces and symbol decoding work natively:
monitor_boot— One-shot: resets the board, captures boot log for N seconds, returns everything. The diagnostic workhorse.monitor_start— Starts a persistent background session with board reset. Returns initial boot output.monitor_send— Sends a command to the device. Write-only — doesn't pretend serial I/O is request-response.monitor_read— Polls buffered output. Works even after the process exits so you don't lose the last lines.monitor_stop— Kills the entire process group (not just the parent), frees the port, and returns the remaining output.
Real Use Case
I was working on a sensor array PCB with an ESP32-S3, which I recently designed. Unfortunately, the host-side scripts weren't getting the correct data, so I asked Claude Code (with the ESP-IDF MCP connected) to help.
The agent's first move was to call monitor_bootto capture the boot log. It came back with a sensor initialization warning — one of the sensors was returning ID 0x00instead of the expected value. The SPI bus and demuxers initialized fine, but nothing downstream was responding.
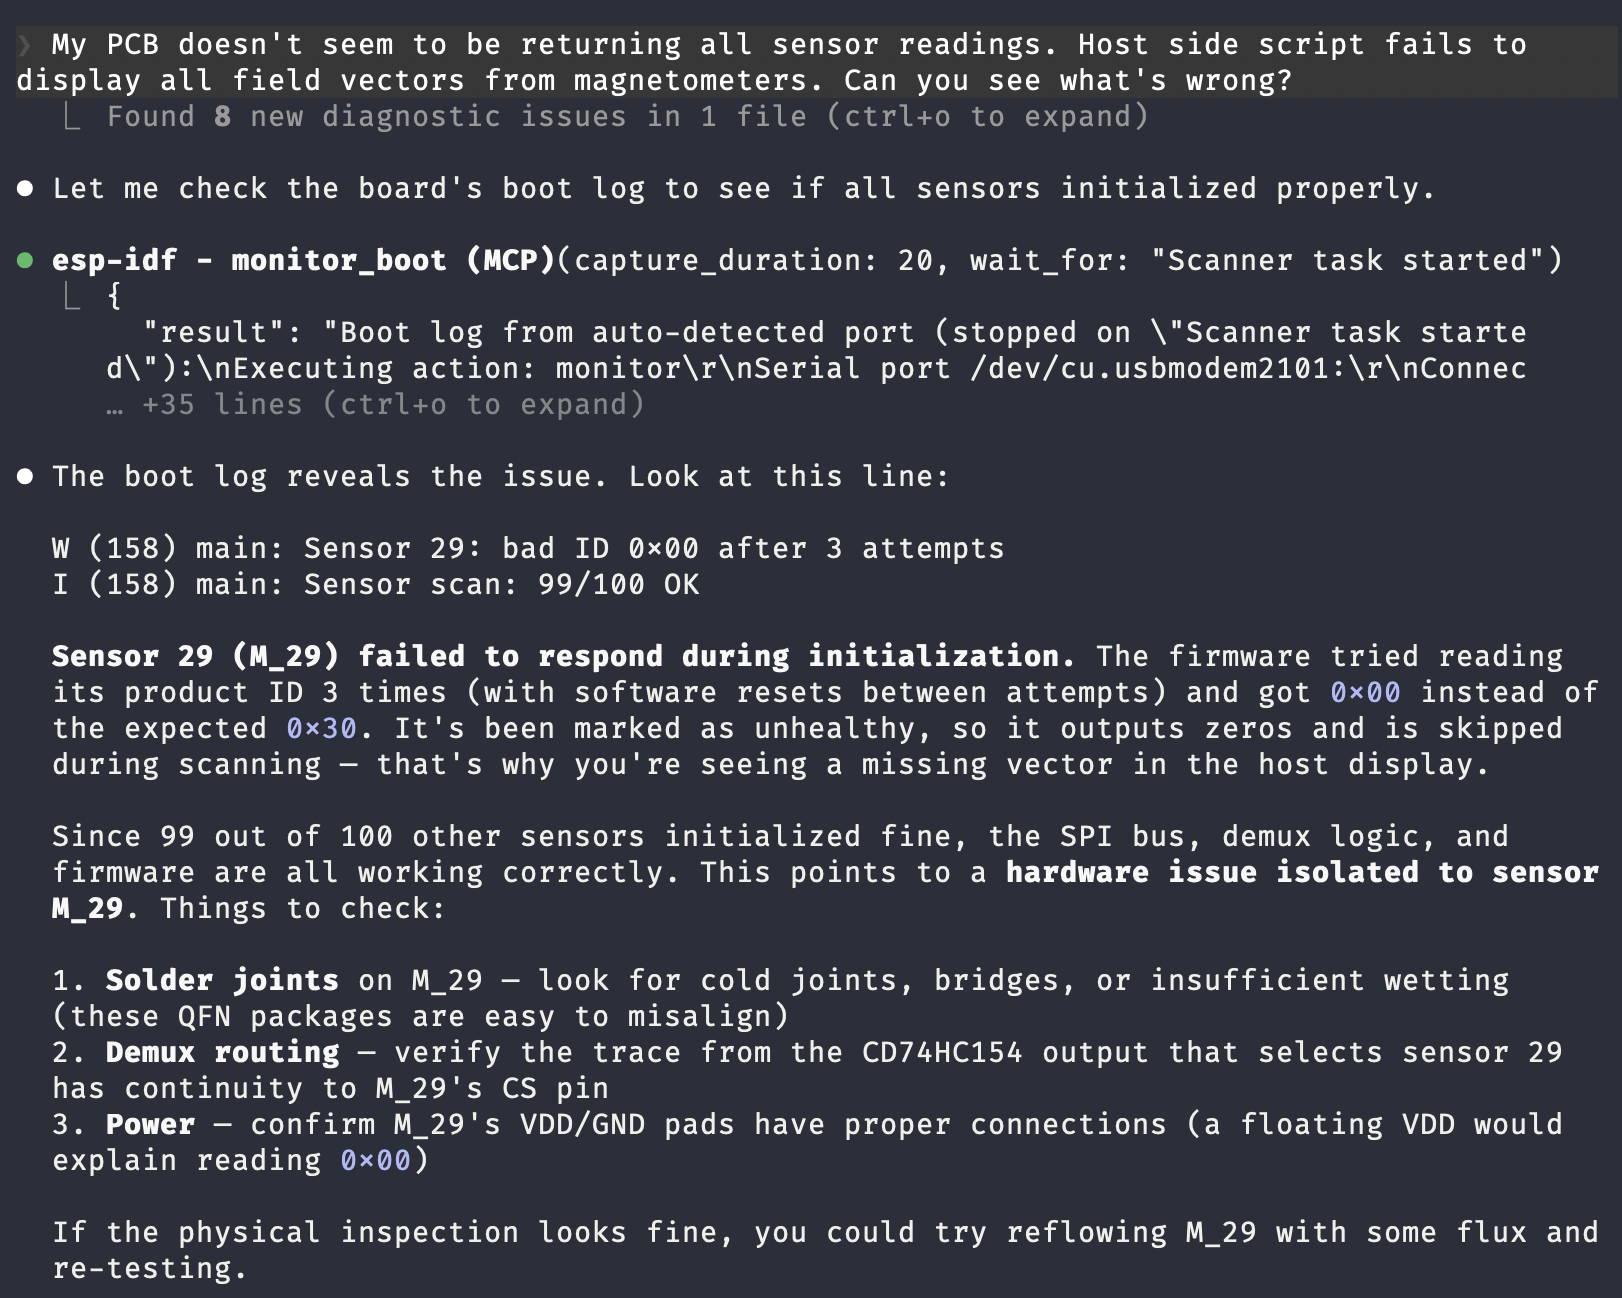
The agent correctly diagnosed it as a hardware connectivity issue in about 30 seconds. It even suggested reflowing the specific sensor, and that fix was correct! No manual terminal session, no copy-pasting logs. The agent read the device's own diagnostic output, drew the right conclusion, and told me exactly what to do with a soldering iron.
That's the difference monitor access makes. Build and flash are push operations. Monitor is the feedback loop. Without it, the agent is guessing. With it, it can actually debug.
Status
The PR is open on esp-idf. It passes all pre-commit checks and has been tested on macOS with ESP32-S3 over USB CDC. The code and setup instructions are also available here.